

One of the best ways to grow a social media audience is through posting consistently. You should post quality content on a regular basis to:
- Keep your current audience engaged
- Reach and engage new audiences
We have multiple posts on social media marketing (like tips on picking the right platform, dos and don’ts, and fun marketing ideas). You should definitely check those out if you haven’t yet. In this post, we’re going to look at some numbers from one of our client’s Facebook and Instagram pages. We’ve been managing this client’s social media for six months and we’ve been posting an average of three to five posts a week. You’ll be able to see the difference that posting consistently can make.
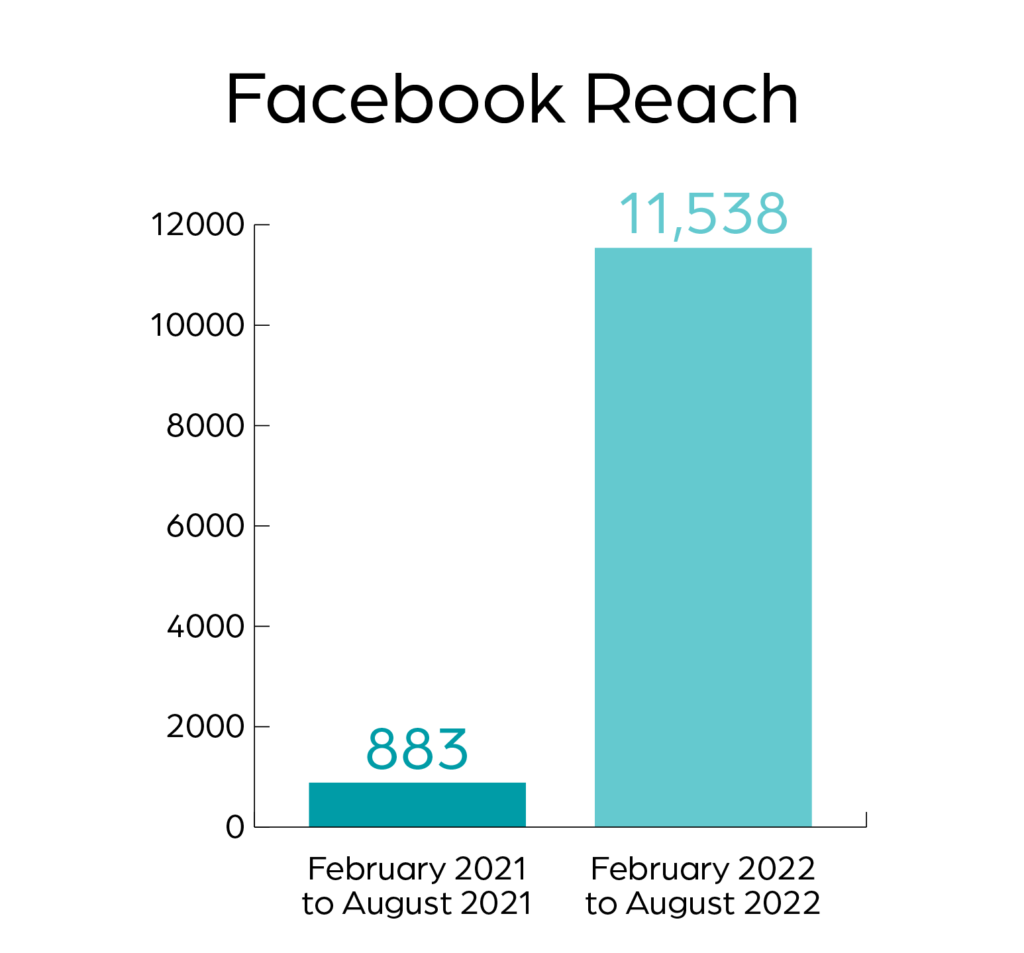
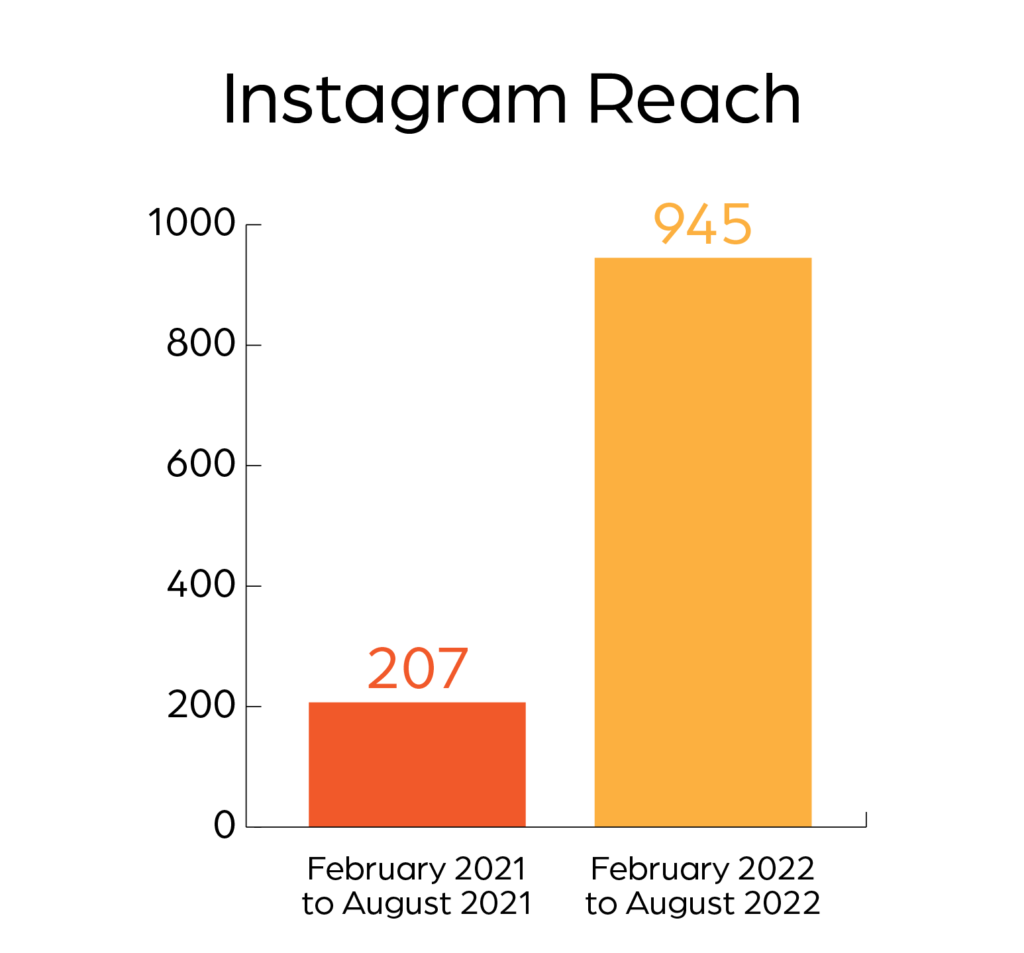
Facebook and Instagram Reach
In this case, “reach” is similar to what other sites may call “impressions.” It refers to the amount of times your post appears on someone’s feed. Increasing your reach can help to get your information in front of more people.
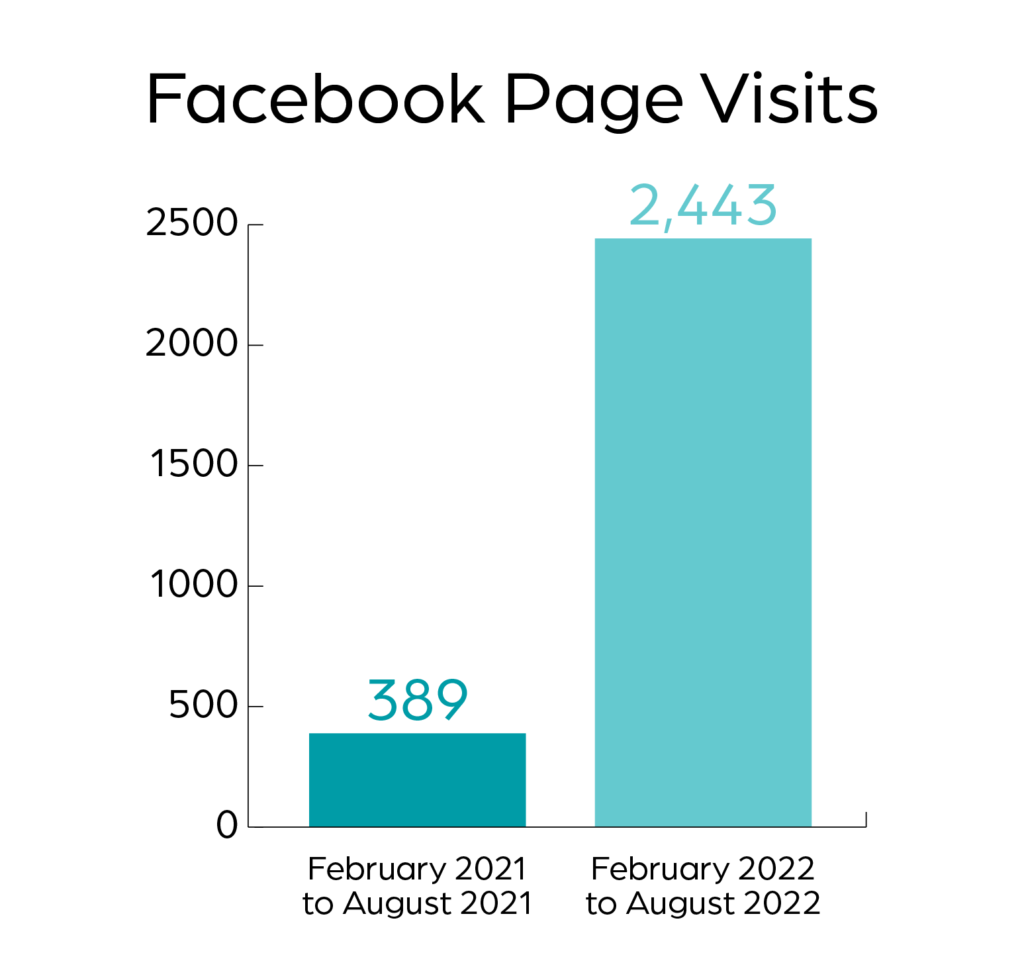
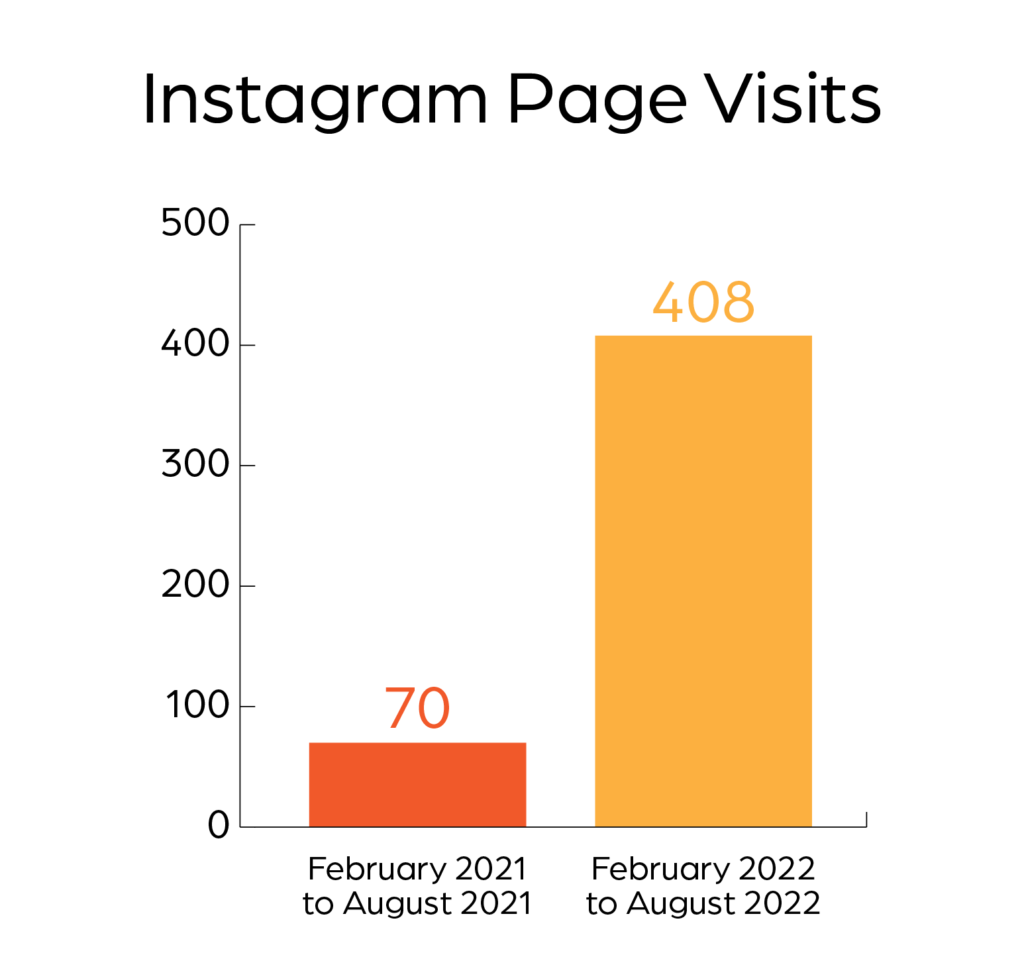
Facebook and Instagram Visits
These graphs show the number of people who visited the client’s Facebook and Instagram pages. As the number of people reached by the client’s posts went up, it brought the number of visitors up as well. By creating content that people find helpful or entertaining, you can draw in more visitors to your business’s page.
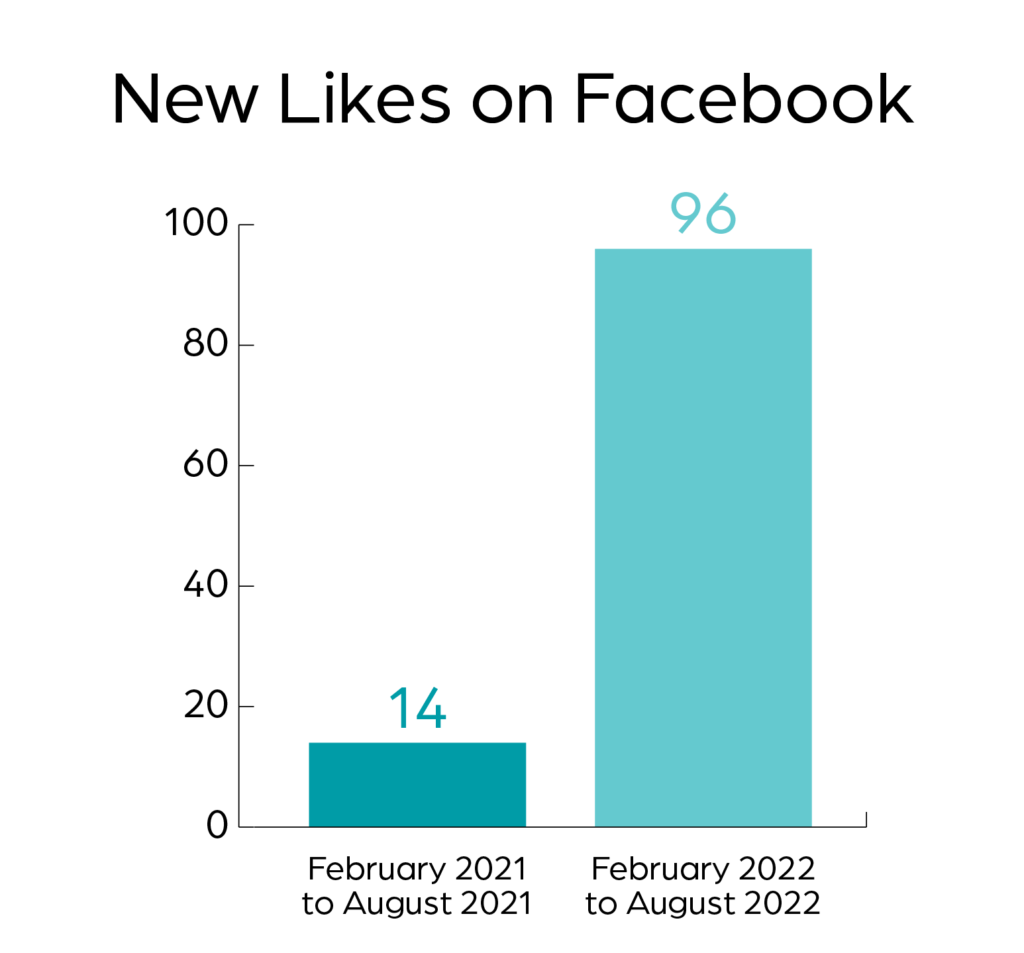
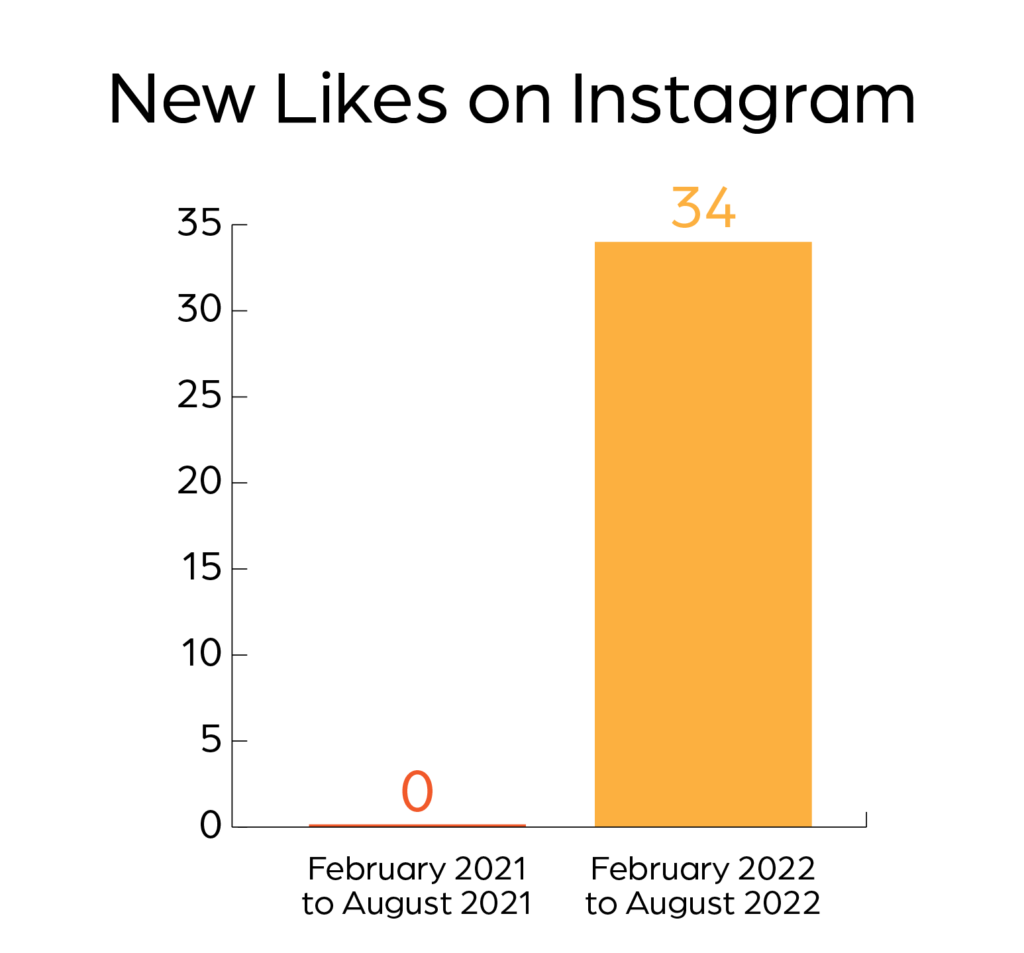
Facebook and Instagram Likes
The third set of graphs shows the increase in the number of likes that each page received. More people saw the posts, more people visited the pages, and, as a result, more people decided they wanted to see more.
In Conclusion
These graphs have showed a real-life example of what consistent posting can do for your social media. If you are a small business owner and you’re interested in marketing on social media, contact Bold River Marketing. We can help you manage your social media accounts, create compelling content, and schedule posts to increase your audience and grow your business.